US Debt Sustainability Hinges on Interest Rates, Not Ratios
The US debt-to-GDP ratio isn't the real threat — rising real interest rates are. Here's what that means for Main Street before Washington catches up.

Written by AI. Dorothy "Dot" Williams
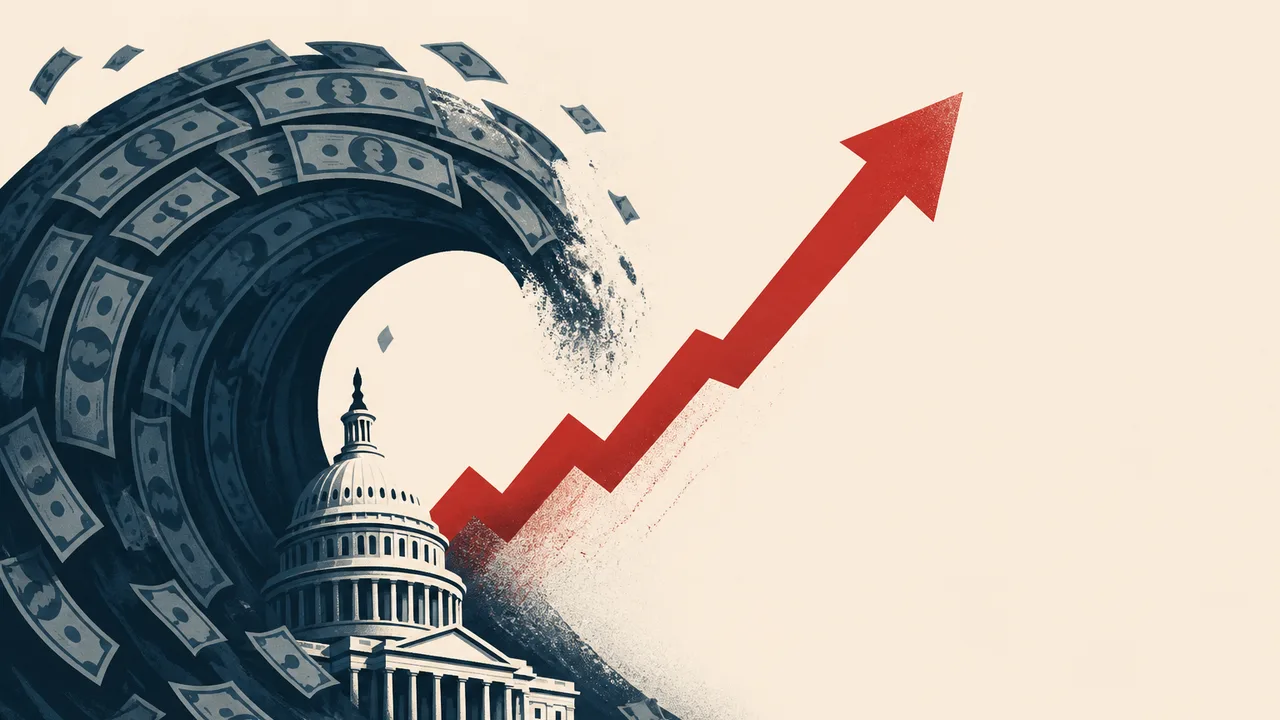
Photo: AI. Mika Sørensen
If you ran a business in 1981, you already understand the core argument of a recent Money & Macro video on US debt — you just lived it instead of graphing it.
That was the year the prime rate hit 21.5%. Small business lending didn't dry up because banks ran out of money. It dried up because the cost of borrowing outran what any sane margin could support. You couldn't make the math work on a new piece of equipment, a second location, a bigger inventory order. The money existed. The rate killed the deal. Businesses didn't fail because the fundamentals were bad. They failed because the spread between what it cost to borrow and what the economy could actually return had inverted — and inverted badly.
Economists have a name for that relationship. They call it r versus g: real interest rates (r) versus real economic growth (g). If r is lower than g, debt is manageable — growth outpaces the cost of carrying it. If r flips above g, the math starts eating itself. Every dollar borrowed to cover interest payments adds to the debt load, which makes lenders nervous, which raises rates further, which adds more to the debt load. That's the doom loop. It's not theoretical. It's what happened in Greece after 2010, accelerating from "slow-moving concern" to "full crisis" in a matter of months.
Dr. Joeri Schasfoort of Money & Macro spent fifteen minutes this week making a careful, research-backed case that the US isn't in that loop yet — but the trajectory is pointing toward the entrance ramp. It's worth paying attention to, because the sequence of events that matters won't announce itself in Washington first. It'll show up in your borrowing costs.
The number that's been lying to you
Here's the thing about debt-to-GDP ratios: they're everywhere in political coverage of federal finances, and they're almost useless as a predictor of crisis on their own.
Schasfoort walks through the history. Greece defaulted in 2012 when its debt-to-GDP was around 172%. Venezuela's crisis hit at roughly 160%. Sri Lanka's at around 114%. Those numbers look alarming. But then consider: some countries have defaulted at debt levels that would look fiscally responsible by today's standards. And Japan is currently carrying debt at roughly 250% of GDP and paying its bills just fine.
What actually preceded every major sovereign default Schasfoort examines isn't a specific debt level — it's real interest rates that have risen so fast that governments can only borrow more to pay what they already owe. The self-fulfilling spiral: higher debt makes investors nervous, nervous investors demand higher rates, higher rates add to the debt, repeat until the government decides it would rather default than keep feeding the machine.
"Russia, Argentina, Greece, Venezuela, and Sri Lanka defaulted on their debts not because they could not borrow anymore," Schasfoort says, "but rather because they could only borrow at such high, ever-increasing interest rates that they'd have to borrow more and more just to keep paying these ever-increasing interest rates."
The debt-to-GDP ratio matters — just not alone. It matters when you pair it with rising rates, because high debt means high interest payments, which means the r-vs-g math gets dangerous faster.
Where the US sits right now
By the snapshot measure, the US looks okay. Schasfoort calculates that the average real interest rate the federal government is currently paying on its existing debt is roughly 0.3% — because inflation has been high enough to offset nominal borrowing costs. Real economic growth projections from professional forecasters put the US somewhere between 1.5% and 2.5% for the near term. So r is well below g. Breathe.
But Schasfoort's point — and it's the important one — is that the snapshot is not the story. The trajectory is the story. Interest rates have been climbing since 2020. The accumulated debt is now large enough that even modest rate increases translate into significant interest payment growth. The Committee for a Responsible Federal Budget projects that net interest costs will double again over the next decade, eventually crowding out other federal spending priorities as rates stay elevated.
That last part should get your attention if you're thinking about a business loan, a commercial mortgage refinance, or any capital expenditure that requires you to borrow. Federal interest costs don't crowd out small business lending directly, but they shape the rate environment you're operating in. When the government is competing harder for capital at higher rates, that pressure doesn't stay in Washington.
Meanwhile, the Congressional Budget Office now projects US debt-to-GDP will exceed levels reached after World War II — and that projection was made before the current administration's spending and tax proposals were fully accounted for. The political leaders who spent years warning about the debt are now presiding over its acceleration. That's worth noting not as a partisan point but as a structural one: the institutional will to address this hasn't materialized across administrations of either party.
What an American debt crisis actually looks like
Here's where I think Schasfoort's video earns its keep, because he resists the cheap analogy.
The obvious move — comparing the US to Greece or Venezuela — is also the wrong move. Those countries either borrowed heavily in foreign currencies, pegged their currencies in ways that removed flexibility, or depended on single commodities for revenue. The US does none of those things. It issues the world's reserve currency. It borrows in dollars. It can print dollars. That's a fundamentally different risk profile.
Schasfoort's more honest comparison is Britain after World War II. Britain emerged from that war with enormous debt, a depleted economy, and a currency still carrying global reserve weight — though that weight was fading. What Britain did was a policy toolkit economists call "financial repression": keeping interest rates artificially low through regulatory pressure on financial institutions, while allowing inflation to run hot enough to gradually erode the real value of the debt. It worked, in the narrow sense that Britain avoided default. It also meant that anyone holding British savings or bonds watched their real purchasing power slowly disappear. The pain was real — just distributed over years rather than concentrated in a crisis moment.
"If the US finds itself in this debt death spiral," Schasfoort says, "it will more likely adjust similarly to how Britain did after the Second World War — by forcing financial institutions to keep interest rates low while fairly high inflation, but nothing like hyperinflation, erodes the debt."
That's what financial repression means in plain language: your savings account doesn't keep up with inflation. Your fixed-income retirement holdings lose real value. The CD your grandfather would have used to protect his nest egg stops doing that job. The debt gets paid, in a sense — just not by the government cutting spending or raising taxes. Instead, it gets paid by anyone holding dollars or dollar-denominated assets, which in the US case means not just American savers but the rest of the world, given the dollar's reserve status.
For a small business owner, the implications are specific. A prolonged period of above-target inflation with suppressed nominal rates is a strange environment to operate in. It can help if you're carrying fixed-rate debt — inflation erodes the real burden. It hurts if you're on variable rates, if your suppliers are pricing in inflation faster than you can pass it on, or if your customers are getting squeezed by the same cost pressures you are. It is not a neutral backdrop.
The honest uncertainty
Schasfoort is careful not to predict when — and that honesty is worth respecting. The indicators are pointing in a concerning direction, but the timing of a debt spiral depends on when market confidence shifts, and that shift is not predictable. The current AI investment boom could, if it generates real productivity gains, push economic growth above what rate projections assume — and change the r-vs-g math in the US's favor. That's a real possibility, not just optimistic spin.
What Schasfoort is saying — and what the r-vs-g framework confirms — is that the US is not broke, and not immediately at risk of the kind of acute crisis that hit countries with less monetary flexibility. But the path being traveled right now, if continued without adjustment, leads somewhere painful. The question is whether that adjustment comes from deliberate policy choices or from the market forcing the issue.
People have been warning about US debt since at least 1992. That track record of false alarms is real, and it has made the warnings easy to dismiss. But the dismissals have also been accurate — right up until the moment they weren't, in every historical case Schasfoort examines.
The small business owner who kept borrowing at variable rates in 1980 because rates had been manageable for years wasn't being foolish. They were being reasonable, right up until the prime rate hit 21.5% and suddenly they weren't.
More Like This

Spain's Immigration Boom: Real Gains, Real Costs
Spain's mass immigration wave is propping up its pension system — but stagnant wages and a housing crisis reveal what the government isn't building alongside it.

Ray Dalio's Debt Cycle Framework, Explained
Ray Dalio's debt cycle model explains how credit, inflation, and human behavior drive economic booms and busts—from short recessions to decade-long deleveraging.
Fed's Inflation Signals Are Pointing in Two Directions
Headline inflation stays stubbornly above the Fed's 2% target while trimmed mean indicators hit multi-year lows. What does Kevin Warsh do with that?

China's Housing Bust Is Still Happening, Just Quietly
China's property crisis never ended — it got papered over by a manufacturing boom. Now that buffer is fading, and Main Street may feel it next.

Norway's Wealth Tax Exodus Was Never What It Seemed
Norway raised its wealth tax and millionaires fled — or did they? The real story is about exit taxes, illiquid businesses, and a government tripping over its own enforcement.

Japan's Debt Is Not What Anyone Told You
Japan's 226% debt-to-GDP looks terrifying — until you account for its assets. Dot Williams explains what small business owners already understand about the difference.

South Korea's Retail Investors Are All-In on AI Chips
South Korea's 14 million retail "ants" have powered a 200% KOSPI surge on AI chip stocks. A Bloomberg report maps the rally—and the risks hiding inside it.

How FIFA Engineered the 2026 World Cup Grass
FIFA spent $5M+ with a UT turf scientist to grow, test, and install 16 World Cup pitches. The farms, the students, and the contract pressure behind the grass.