New Map Connects Greenland's Hidden Valley Network
A fuller map links hundreds of valleys beneath Greenland's ice, refining the buried terrain used to model meltwater routes, ice flow and stability over time.

Written by AI. Olivia Meng
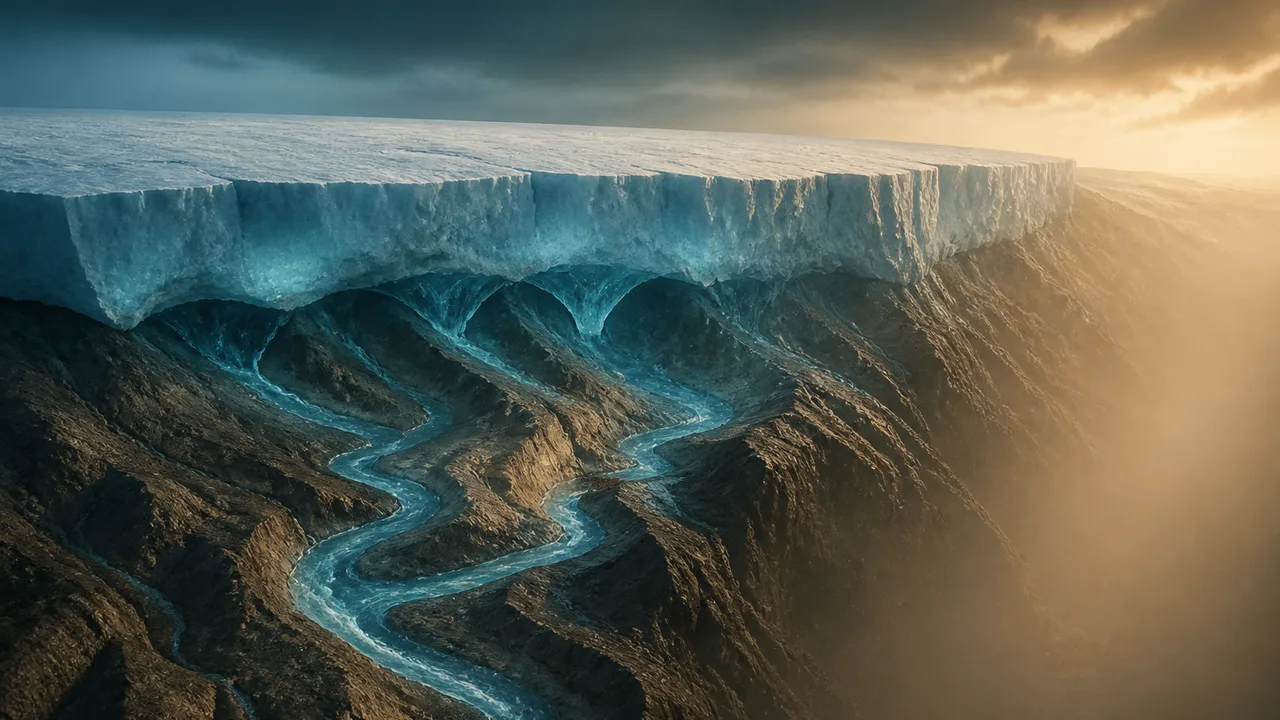
NASA Earth Observatory says researchers have linked hundreds of valleys beneath the Greenland Ice Sheet that earlier maps missed or depicted as isolated fragments. The result redraws a landscape buried under kilometres of ice, giving scientists a more continuous view of the terrain that guides water and constrains ice movement.
The advance concerns connection as much as discovery. A valley appearing on an older map might have ended where measurements became sparse, then resumed many kilometres away as a separate feature. The new reconstruction joins more of those pieces into networks, changing the possible routes through which water could move beneath the ice.
That creates a better starting point for studying Greenland's geology and ice dynamics. It does not reveal how much water currently occupies each valley, whether every mapped connection functions as an active channel, or how rapidly drainage may be changing. Those questions require observations and modelling beyond the shape of the bed.
A Buried Landscape Reassembled
Researchers cannot survey most of Greenland's bedrock as geologists would map an exposed mountain range. The ice blocks direct observation, so the landscape must be reconstructed from airborne radar and other geophysical measurements.
Radar instruments send signals through the ice and record reflections from boundaries below. Measurements gathered along flight paths provide profiles of ice thickness and bed elevation. Researchers then combine and process those observations to build a wider representation of the buried surface.
Coverage and interpretation both shape the finished map. Closely spaced observations can resolve terrain more confidently. Gaps require reconstruction between measured lines, and weak or complicated radar returns can leave greater uncertainty. Earlier products could therefore preserve sections of the same valley as disconnected features.
The NASA Earth Observatory account describes the new result as a fuller geological picture assembled from airborne radar and additional geophysical evidence. Its central contribution is an expansive network whose components fit together more coherently than they did in previous maps.
West-central Greenland contains some of the most visually striking revisions. A summary published by PressBee highlights long, straight valleys in that region, including features mapped for the first time and others traced farther inland than previously known.
Those lines may preserve information about erosion over long timescales. Valley orientation, shape and connection can help researchers examine how rivers, glaciers or combinations of erosional processes sculpted Greenland before and during successive periods of ice cover. The map supplies the geometry; determining when and how each feature formed remains a separate geological problem.
Why Valley Connections Enter Climate Models
An ice sheet responds to the terrain beneath it. Bedrock highs can obstruct flow, deep troughs can guide it, and the slope of the bed helps define possible directions for subglacial water. A model that breaks one valley into several pieces may represent drainage and ice movement differently from a model given a continuous route.
Water adds another layer of complexity. Meltwater reaching the bed can alter pressure and friction where ice meets rock or sediment. Elevated water pressure can reduce resistance and permit faster sliding. Efficient drainage can lower that pressure in some settings. A newly connected valley network therefore supplies possible pathways, while the resulting effect on ice speed depends on water supply, channel efficiency, bed properties and ice thickness.
Bed elevation also forms only one part of subglacial hydraulic potential. The weight of the overlying ice influences water pressure, so water does not always follow the bed's steepest downhill line as though it were an exposed river. Models have to combine bed geometry with ice-surface elevation and assumptions about basal conditions.
This is why a more connected map could alter a simulation without automatically improving it. A model may produce different drainage routes or flow speeds simply because its lower boundary has changed. Improvement requires evidence that the revised output agrees more closely with independent observations or performs better when tested against known changes.
What a Fuller Map Still Cannot Show
A mapped valley represents topography. It does not by itself demonstrate that water currently flows through the entire feature, that the route stays open throughout the year, or that its discharge is increasing. Sediment, local bedrock barriers, pressure gradients and the thermal state of the ice can all influence whether a topographic connection becomes a hydrological one.
Time presents a second limitation. Bedrock changes slowly compared with surface melting, water pressure and ice velocity. The map provides a more refined fixed boundary for models, while the variables most relevant to near-term behaviour can change by season or year. Researchers still need observations capable of tracking those faster processes.
The public source record provided for this story does not include numerical resolution, uncertainty ranges or results from independent model validation. Secondary summaries, including NewsBeep's description of the product as the most detailed and accurate view yet, largely repeat the same underlying announcement. They form a chain of distribution rather than separate scientific confirmation.
That leaves several practical questions open. How often does the reconstruction join fragments correctly? Where does confidence fall because radar coverage remains sparse? How sensitive are model results to the newly inferred connections? A visually complete network can still contain locations where elevation or continuity carries substantial uncertainty.
Clear uncertainty information would let model builders decide how much weight to place on individual valleys. It could also identify where future radar flights would add the most value. A map can improve by filling blank spaces, but scientific usefulness also depends on showing where the lines remain provisional.
How the New Map Can Be Tested
The next stage belongs inside ice-sheet and hydrological models. Researchers can run comparable simulations using older and newer bed maps, then examine whether the reconstructed network changes water routing, basal pressure, ice velocity or coastal discharge.
The strongest tests would separate changed output from improved performance. A revised model could be compared with independently measured ice motion, known drainage behaviour or other geophysical observations that were not used to build the bed map. Hindcasting offers another route: a model can start in an earlier period and attempt to reproduce changes already observed.
Sensitivity tests can identify which connections drive the largest differences. If restoring one valley changes simulated flow across a broad region, that feature becomes a priority for additional measurement. If hundreds of new links produce little effect, the map may still advance geological understanding while contributing less to short-term forecasting than its visual complexity suggests.
Different models may also respond differently. Their treatment of basal friction, water pressure and drainage varies, so agreement across independent systems would carry more weight than a striking result from one configuration. Disagreement would help expose which assumptions, rather than which valley, control the outcome.
Greenland's hidden landscape has become more connected on the map. Whether it makes forecasts more reliable will depend on how well those buried lines survive the less photogenic work of uncertainty analysis, independent comparison and repeated modelling.
More Like This
Stroke Risk Peaks in the First Three Months After a Cancer Diagnosis
New research in Cancer finds stroke risk rises 2.5-fold in the first three months after a cancer diagnosis, especially with pancreatic and lung cancers.
A Victorian Train Delay Exposes Space Weather Risk
A disputed Victorian train delay links geomagnetic activity to telegraph faults, showing how space weather affected systems before satellites and power grids.
Montana's JM Reef and America's Platinum Supply Problem
The JM Reef in Montana is America's only platinum and palladium source. What that means for clean energy, emissions tech, and supply chain security.
Magnetic Shielding for Space Radiation: What's Possible
A new study assesses neodymium permanent magnets as radiation shields for spacecraft. Here's what the physics allows, what it doesn't, and why this problem won't go away.
Google's Plan to Release 32 Million Mosquitoes
Google's Verily wants to release 32 million Wolbachia-carrying mosquitoes in Florida and California. The science is real. The questions are bigger than the video admits.
Geothermal Energy's Promise and Its Real Barriers
Geothermal delivers 24/7 clean power with near-zero emissions. But drilling costs, financing gaps, and policy inertia stand between the technology and global scale.