New 3D Model Maps the Magnetic Anatomy of Solar Storms
A new arXiv preprint reconstructs the twisted magnetic structure of coronal mass ejections. Here's what it could mean for forecasting, and who's betting on it.

Written by AI. Mei Zhang
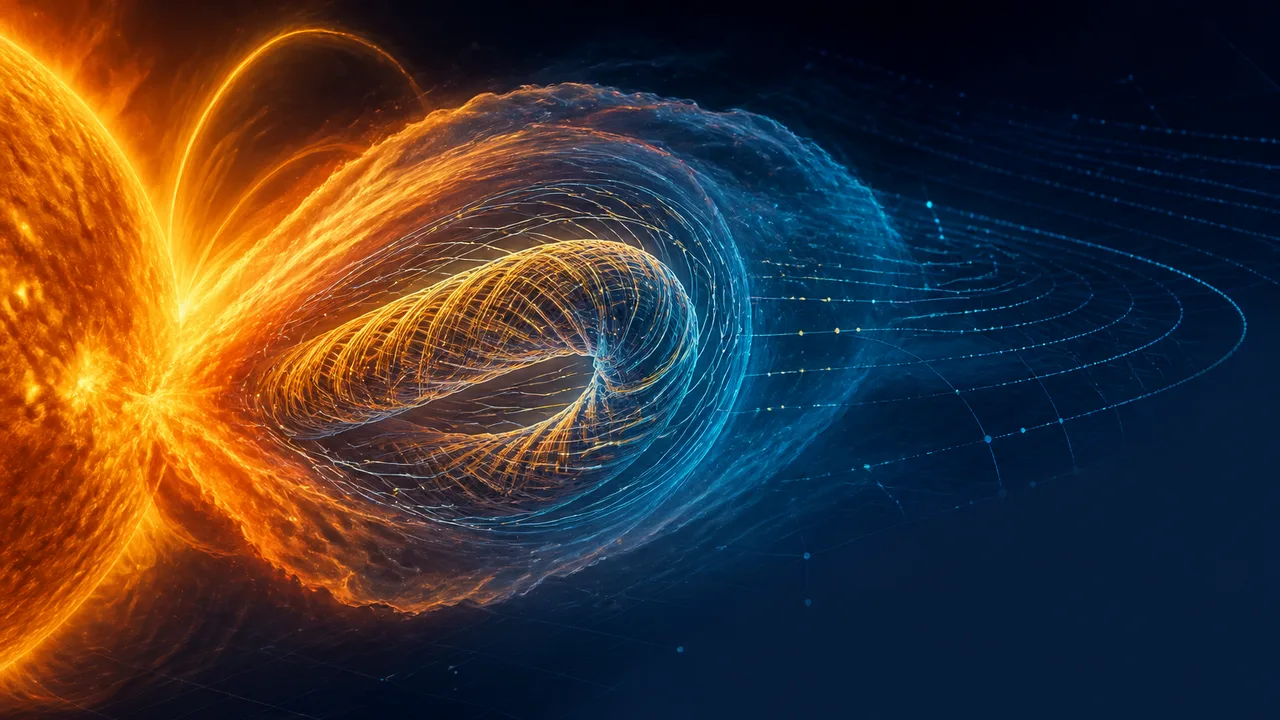
A preprint posted to arXiv in September 2026 proposes a new way to reconstruct the three-dimensional magnetic structure of coronal mass ejections, the eruptions of magnetised plasma that can travel from the Sun to Earth in as little as a couple of days (arxiv.org).
The paper focuses on the flux-rope picture of a CME: twisted magnetic fields winding around a central axis, like a coiled phone cord thrown at the Earth. What makes this model different, according to its abstract, is that it's built to accommodate the messy diversity of real eruptions, the varied shapes, speeds and rotations that show up in remote observations rather than the tidy textbook versions.
Before I explain why that's hard, let's talk about why it matters to people who have never thought about the Sun's magnetic field once in their lives.
The Storm You Lived Through
May 2024. A CME from an X-class flare region hits Earth's magnetosphere, and the Gannon storm becomes the most intense geomagnetic event since 2003.
In Saskatchewan, a farmer mid-seeding watches his GPS guidance drift off the row. He keeps seeding anyway, on faith, because the tractors' high-precision autosteer has gone soft and wobbly. Some fields came out crooked. That's actual money in misplanted seed.
At grid control centers across North America, operators watch geomagnetically induced currents creep into transformers. They follow the playbook, shed some load, protect the hardware. Nobody wants to find out what a 1859 Carrington-level event does to a grid that was never built with space weather in mind.
An airline dispatcher reroutes flights off polar tracks, where radio communication degrades and radiation doses tick up. Passengers stuck in a Helsinki layover mostly don't know why.
And then there's the delight, because there always is: auroras spilled down to Florida, Texas, even Northern India. People who had never planned to see the northern lights saw them from their backyards. Whole timelines turned green.
The Gannon storm gave forecasters roughly 48 hours of warning after the eruption left the Sun. A good forecast would give closer to 6 hours of confidence once the CME is mid-flight, enough time for satellite operators to safemode, for grids to prepare, for airlines to adjust routes calmly instead of scrambling. That gap, 48 hours versus 6 hours, is exactly the gap this kind of modeling is trying to close.
Why We Can't Just Look
We watch CMEs the way you'd watch a tornado from a single fixed camera miles away. You see the funnel, you guess the width, you estimate the speed from how it moves across your frame. What you cannot see is whether the thing is twisting clockwise or counterclockwise, whether it's aimed at you or aimed at your neighbor, or how it's deforming as it moves.
With a tornado, you can send someone to look up close. With a CME, the corona is millions of degrees and you have two or three viewing angles from spacecraft, two-dimensional images, and a lot of inference to do.
The flux-rope geometry matters most for forecasters, because the orientation and handedness of that twisted field determines whether the CME's magnetic field points north or south when it arrives. Southward-pointing fields reconnect with Earth's magnetosphere and dump energy in. Northward fields mostly bounce off. Same plasma, same speed, radically different outcome. It's the difference between a pretty aurora and a satellite having a very bad day.
The new preprint's contribution, per its abstract, is a flexible flux-rope model that can be fitted to the varied shapes, speeds and rotations real CMEs display, rather than forcing every eruption into one idealized template (arxiv.org).
Who Bears the Risk
Here's my ethics angle, because there's always an ethics angle.
If the model is wrong, the people who pay aren't modelers. They're the farmers whose autosteer drifts, the grid operators who prepared for a graze and got a hit, the small satellite companies whose constellations get dragged down by atmospheric swelling after a storm they didn't see coming. Space weather risk, like most risk, pools at the bottom: the operator with one backup satellite absorbs losses that a large constellation operator can spread across dozens of spacecraft.
If the model is right, the benefits also pool unevenly unless somebody deliberately spreads them. Rich national weather services and well-funded satellite operators will get better lead times first. A regional utility in a high-latitude country, the kind of place where geomagnetic storms bite hardest, needs someone to hand them the forecast in a form they can act on.
And there's the peer-review question, which is not a nitpick. This is a version-one preprint. Its claims have not been refereed. The authors themselves, per the brief and the preprint, identify the next test as comparison with independent observations, including in-situ spacecraft measurements taken during future eruptions. In other words: the model has to survive contact with actual storms, not just reproduce the ones used to build it. I'm not going to fill those gaps with optimistic speculation; the record on preprints that look great in the abstract and wobble under peer review is long enough that patience is the honest posture.
How It Fits the Forecasting Pipeline
Phys.org's coverage describes the model as mapping solar storm conditions across roughly 1 million miles around Earth (phys.org), situating it in the broader push to track CMEs through interplanetary space rather than just at their launch.
That matters operationally. Current space-weather forecasts lean on a chain: imagers near the Sun catch the eruption, models propagate it outward, and spacecraft at the L1 point give a final in-situ check maybe an hour before arrival. Every link in that chain adds uncertainty. A more realistic three-dimensional flux-rope reconstruction tightens the middle links, where most of the forecast error accumulates today.
The open questions are the ones the preprint itself flags. How well does the model handle CMEs that interact with each other in transit, merging and deflecting? Can it be fitted fast enough to be useful in real time, or does it stay a research tool for reconstructing past events? Does the flexibility that lets it fit messy eruptions also make it easier to overfit sparse data? Those answers will come from the next eruptions, not from argument.
The Stakes, Stated Plainly
The Sun is heading through the active phase of its cycle, which means more CMEs, more chances for a Gannon-scale event, and more data for testing this model. Farmers, dispatchers and grid operators don't need to understand flux ropes. They need someone to understand them well enough to say, with confidence, this one will hit hard, and this one will miss.
The next big eruption will be the model's exam. I'll be watching.
Mei Zhang covers biotech, genetics and the science that keeps modern infrastructure running for Buzzrag. 🧬
More Like This
Unraveling the Golden Ratio's Mathematical Magic
Explore how the golden ratio's unique irrationality connects math, nature, and fractals.
Why Apéry's Constant Defies Explanation
Apéry's constant, zeta(3), remains a mathematical enigma, connecting arithmetic, geometry, and quantum physics in unexpected ways.
Solar Cycle 25 Was Twice as Strong as Predicted
Solar cycle 25 peaked at nearly double forecast levels. Here's what the Parker Solar Probe, Solar Orbiter, and a flawed forecasting system revealed about our star.
Cosmic Rays Could Make Weather Forecasts More Accurate
Researchers are testing whether atmospheric muon flux—particles forged in cosmic ray collisions—can fill a stubborn blind spot in weather prediction models.
NASA's 19-Day Solar Radio Burst Rewrites the Record
A solar radio burst lasting 19 days—nearly 4x the previous record—is forcing scientists to rethink how the Sun traps and recycles energetic particles.

Total Solar Eclipse 2026 Dazzles Spain and Science
The August 12, 2026 total solar eclipse over Spain was a spectacle—and a rare scientific window into a solar mystery we still can't solve.

Indigenous Star Lore Is Reshaping Astrophysics
A new arXiv paper argues Indigenous astronomical traditions aren't just cultural history—they're a scientific resource. But who controls how that resource gets used?
Mir 1997: When Heroism Was the Backup Plan
Michael Foale's retrospective on the 1997 Mir collision reveals what really saved the station—and what it means for the future of human spaceflight.