Yellowstone Eruption Headlines Need a Reality Check
A recent Yellowstone eruption scenario is a thought experiment. USGS monitoring shows normal activity, while past unrest puts warning signs in context.

Written by AI. Amelia Nwofor
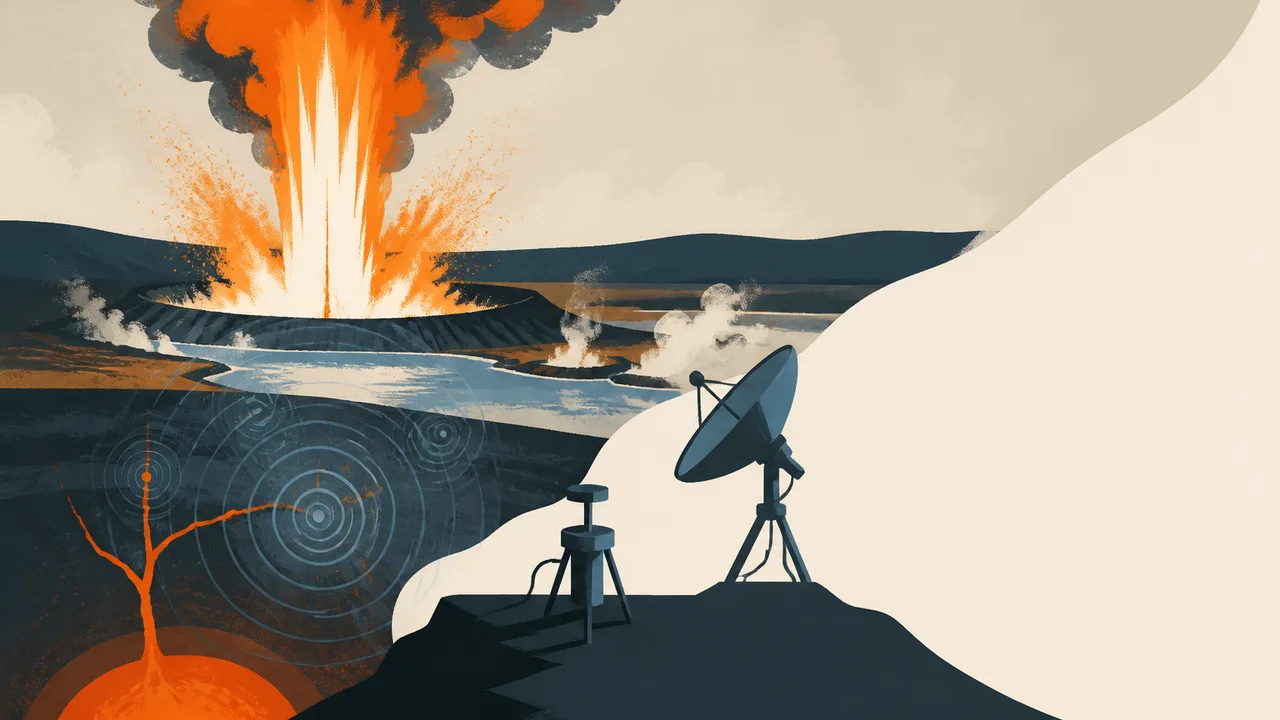
Yellowstone remained at volcano alert level NORMAL and aviation color code GREEN in the Yellowstone Volcano Observatory's September 1 update.
That status provides essential context for recent articles describing earthquake swarms, accelerating uplift, rising eruption probabilities and a vast evacuation zone. The narrative is vivid. It is also explicitly a worst-case thought experiment, not an account of conditions unfolding beneath Yellowstone National Park.
The scenario published by Nautilus begins two months before an imagined eruption. Tiny earthquakes cluster beneath the caldera and migrate upward. GPS stations move apart. Satellite measurements reveal accelerating uplift. Later, earthquakes become shallower, volcanic tremor appears, gas chemistry changes and geysers behave erratically.
Inside that invented sequence, the estimated probability of catastrophe within three months rises from 6 to 9 percent to 21 to 27 percent. An EarthSky publication of the same narrative later puts the probability of a cataclysmic eruption within three weeks at 85 to 92 percent, followed by an imagined 100-kilometre evacuation zone.
Those percentages belong to the scenario. They are not current estimates issued by the observatory. Their appearance in more than one publication also supplies repetition, rather than independent evidence that Yellowstone's condition has changed.
The Volcano in the Update, Rather than the Volcano in the Scenario
The observatory's September report recorded 61 earthquakes in the Yellowstone region during August. The largest was magnitude 2.0, and analysts identified no earthquake swarms. The USGS described both seismicity and deformation as being at background levels.
GPS data add another check. Uplift along the north caldera rim began in July 2025, ceased by mid-January 2026 and had not resumed by the September update. The caldera itself had risen by about one centimetre or less over the preceding few months, a change the observatory said could reflect seasonal groundwater conditions.
One month's count should not be treated as Yellowstone's permanent setting. The region averages 1,500 to 2,500 earthquakes a year, according to a February 2026 observatory review, and deformation is part of its normal life as an active volcanic and hydrothermal system. “Normal” therefore means activity within an established background range. It does not mean geologically motionless. Yellowstone would make a poor paperweight.
The useful idea inside the imagined disaster is that scientists do not diagnose an impending eruption from one restless instrument. They examine the number, magnitude, depth and movement of earthquakes alongside ground deformation, gas measurements, heat and hydrothermal changes. A migrating swarm may indicate moving magma, but pressurised water or gas can also fracture rock and produce a similar-looking sequence.
Escalation would depend on the pattern across several monitoring systems and how rapidly that pattern changed. That is why an isolated swarm, a patch of uplift or an unruly geyser cannot carry the conclusion by itself.
Yellowstone Has Produced Alarming Combinations Before
The strongest historical comparison comes from Norris Geyser Basin in 2013 and 2014. Ground there rose at more than 15 centimetres per year while earthquake activity increased. On March 30, 2014, the area experienced the largest Yellowstone earthquake since 1975. Uplift then switched abruptly to subsidence, with no volcanic eruption.
A Yellowstone Volcano Observatory account reports that event as magnitude 4.8 and interprets the episode as the accumulation and release of hydrothermal fluids. Those fluids may have been connected to a deeper magmatic intrusion south of the area during 1996 to 2004.
A peer-reviewed Journal of Geophysical Research study reports the 2014 earthquake as moment magnitude 4.9. It models a longer sequence: deep magma intrusion during 1996 to 2001, followed by volatile material rising and accumulating at shallow levels, perhaps only a few hundred metres below the surface.
The two USGS sources use slightly different magnitude values, M4.8 and Mw4.9. The available material does not resolve why. That tenth of a unit does not change the broader observation: rapid uplift, elevated seismicity and a sizeable earthquake ended in subsidence rather than a magmatic eruption.
The history also resists a tidy choice between “hydrothermal” and “magmatic.” A shallow episode driven by water, gas or other volatile material can have a deeper connection to magma. Scientists infer those links from GPS, satellite radar and seismic data; they cannot open a hatch in the caldera and inspect the plumbing. Models identify processes consistent with the measurements, while leaving room for revision as new observations arrive.
That nuance changes how the 2013 to 2014 precedent should be used. It shows that several conspicuous signals can occur without an eruption. It cannot prove that every future combination will end safely. A precedent narrows interpretation; it does not provide Yellowstone with a script.
A Migrating Swarm Offers Another Comparison
In late December 2008, a large earthquake swarm beneath northern Yellowstone Lake migrated north over ten days. As it passed a GPS station near Lake Lodge, the ground moved about seven millimetres west. Observatory scientists interpreted the paired seismic and ground movement as evidence that pressurised fluids were opening cracks and migrating through the crust.
The comparison with the fictional warning sequence is close enough to be useful. Both involve migrating earthquakes and measurable deformation. The 2008 observations, however, supported fluid movement rather than an imminent super-eruption. Scientists also lacked a consensus on whether the fluids were liquid or gas, although they considered an origin in the upper-crustal magma reservoir most likely.
That uncertainty is ordinary geophysics, not evidence of concealment. Instruments measure effects at the surface and within the crust. Researchers then compare the timing, location and shape of those effects with physical models. Several subsurface processes can produce overlapping signatures, especially early in an episode.
The later stages of the thought experiment deliberately remove much of that ambiguity. Rapid uplift reaches centimetres in days, earthquakes become frequent and shallow, volcanic tremor persists, gases change and geyser behaviour shifts. Taken together, such observations would justify closer scrutiny and perhaps higher alerts. The scenario's strength is showing how evidence might accumulate. Its weakness, if detached from its label, is that invented probability figures and official actions can look like a forecast already issued.
How to Read the Next Yellowstone Warning
Three questions can separate a status report from catastrophe theatre.
First, does the article describe measurements already recorded, or a hypothetical sequence? Words such as “thought experiment,” “worst case” and countdown labels such as “T-2 months” identify the latter, even when a headline uses the present tense.
Second, what does the Yellowstone Volcano Observatory say? Alert level, aviation colour code, earthquake counts, swarm identification and GPS trends provide a monitored baseline. A dramatic article and a NORMAL/GREEN update answer different questions, but only one describes the observatory's assessed status.
Third, are several publications supplying independent findings? Near-identical sequences and matching probability ranges may trace back to the same narrative. Five copies still amount to one scenario.
Yellowstone deserves attention because it is active, monitored and capable of hazardous behaviour. Its September update described background activity, while its history shows why scientists watch changes without assigning every tremor a countdown clock. The next alarming number should send readers first to the date, the alert level and the measurements that produced it.
More Like This
How Volcanoes Work: Formation, Types, and Real Risk
From shield volcanoes to supervolcanoes, here's what geology actually tells us about how volcanoes form, erupt, and how dangerous they really are.
Yellowstone Supervolcano: What the Ash Record Tells Us
The Yellowstone supervolcano's past eruptions left a record written in bone and ash. What that record says about our future is harder to read than it looks.
Gravity's Strangest Effects, From Time to Cosmic Voids
From gravitational time dilation to the Dipole Repeller and LIGO's detections, here's what gravity actually does—and what it still can't explain.
JWST's Little Red Dots May Be Cocooned Black Holes
New JWST spectral data on a single "little red dot" galaxy offers the strongest case yet that they're supermassive black holes wrapped in dense gas cocoons.