Colorado's Activity Ranking Has a Public Access Story
Colorado had the lowest inactivity estimate in a CDC survey. Boulder’s open-space history shows how access is built, and why a state ranking has limits.

Written by AI. Kira Yoshida
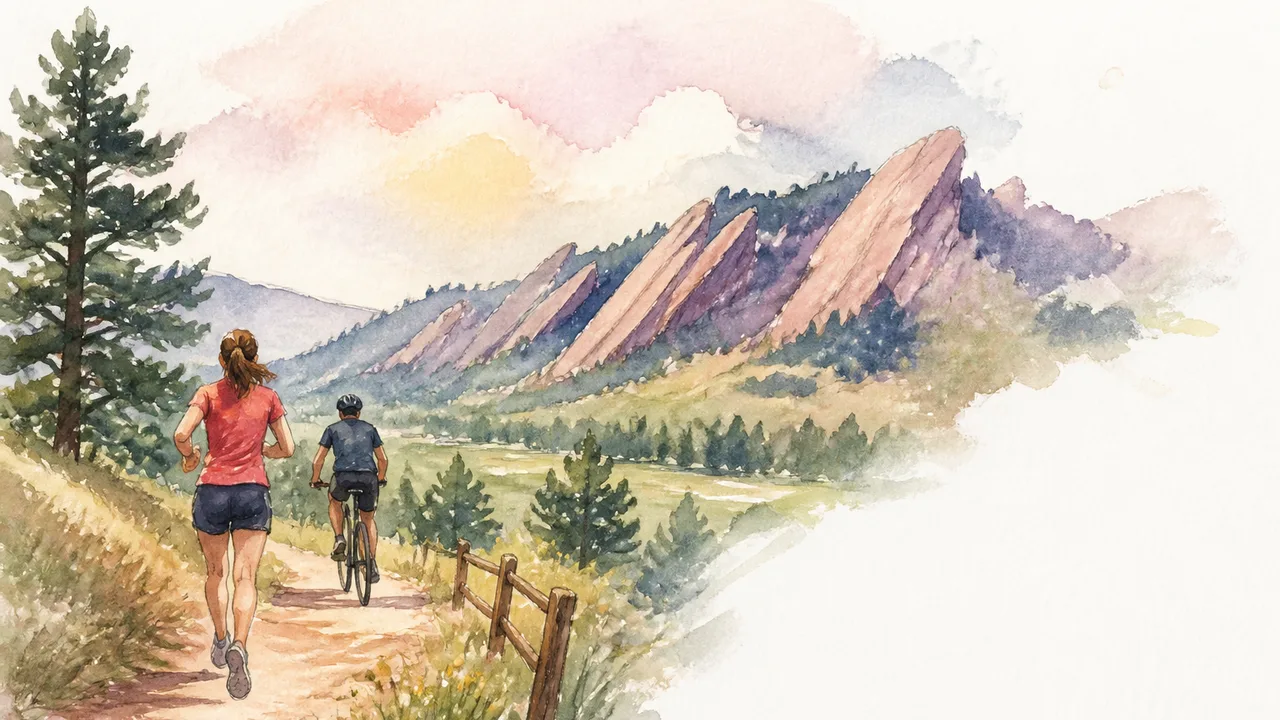
Colorado had the lowest adult physical-inactivity estimate in the CDC’s combined 2017–2020 survey data: 17.7%. That sounds like the opening line of a fitness ad. The more useful question is what the number measures, and what a person needs around them before moving more becomes an ordinary option.
The CDC’s measure came from telephone interviews asking adults whether they had done any physical activity or exercise outside their regular job in the previous month. Gardening and walking for exercise were among the examples in the question. People who answered no counted as inactive. Across the jurisdictions included, the estimate was 25.3%.
That gives Colorado a striking position, but it doesn’t measure how often people moved, how hard they exercised, or whether they met an activity guideline. It excludes movement at work. It also comes from pooled survey years, rather than a reading of Colorado in 2026. Someone who walked once and someone who went out every day could both answer yes. Turning the figure into a portrait of uniformly athletic residents would give one survey question a much bigger job than it can do.
The state also appears near the low end of adult obesity rankings based on a separate Behavioral Risk Factor Surveillance System measure. Those figures use adults’ self-reported height and weight to calculate body mass index. Activity and BMI answer different questions. A body-size ranking cannot tell us who enjoys moving, who has a safe route to do it, or whether a trail changed anyone’s health. Bodies aren’t municipal report cards.
Boulder’s Scenery Has a Voting History
The Rockies were there before Boulder’s open-space program. Public access to protected land around the city has a much more recent history of purchases, boundaries, taxes and maintenance.
The City of Boulder’s preservation timeline begins with residents buying land at what is now Chautauqua Park in 1898. In 1959, a charter amendment established a boundary above which the city would not supply water. Residents then organized against a proposed luxury hotel on Enchanted Mesa in 1964, raising small donations toward the land’s purchase after the city moved to force its sale.
In 1967, Boulder voters approved a sales tax dedicated to buying, managing and maintaining open space. The measure passed with 57% support, the city says. A 1971 charter amendment allowed bonds for land acquisition; in 1973, the city created an Open Space Board of Trustees after residents pushed for a separate department. Voters added more protection and funding in later decades. In 1989, they approved an additional sales tax to accelerate preservation, later extending it. A mountain backdrop became something the city could acquire, protect and care for over time.
That sequence changes how to read today’s activity statistic. If a place keeps nearby land public and maintains routes through it, residents have an option that a mountain visible through a car window cannot supply. Boulder’s history documents sustained choices about land. It cannot tell us how much those choices contributed to a statewide survey result, especially when Boulder is one city within Colorado.
Routes through a city may make the access question even clearer. The Boulder Creek Path has underpasses at major streets, while Denver’s Cherry Creek Trail and South Platte River Greenway provide paved corridors through the city. A path that crosses a street without sending someone into traffic addresses a different obstacle from preserving acreage. Both can make a walk or ride easier to fit into a day, though that possibility alone does not measure how many residents use them.
Consider a person whose nearest trail requires a drive and another whose route passes close to home. Both may live in a state full of public land. Their practical choices differ before motivation enters the conversation. The CDC names unsafe streets, missing sidewalks, lack of time and lack of social support among barriers to physical activity. Asking only whether a state has trails skips the trip to the trail, the street crossing and the time it takes to get there. Accessibility also asks whether a route works for someone’s body and circumstances, a question that acreage alone cannot answer.
What Minneapolis Helps Us Ask
Minneapolis offers a useful comparison with Boulder, provided we compare access questions rather than award either city a fitness trophy. Nearly all Minneapolis residents live within a 10-minute walk of a park, Quartz said. Its description of the city’s Chain of Lakes includes separated paths within the street grid. Boulder’s example emphasizes protected open space and a route through town; Minneapolis brings park proximity into sharper focus.
Those are different measurements. Acres of protected land say how much land has been preserved. A short walk to a park says something about how close a destination is to homes. Neither tells us whether an individual finds the route safe, can use its paths, has time to visit or wants to go. Nor can a comparison of two cities explain Colorado’s statewide inactivity figure. It does, however, give readers a practical way to inspect a claim about “access”: ask where the entrance is and how someone reaches it.
Colorado’s own geography complicates the postcard version. Rural counties have higher reported obesity rates than the Front Range, and Quartz reports income differences alongside that obesity-rate pattern. Those observations concern obesity, so they should not be treated as county-level inactivity figures. They do show why a low statewide body-size ranking cannot describe every community or stand in for an access map.
Who lives in a place can shape an average, too. Some people move to Colorado in part for outdoor recreation. Housing costs in Summit County have pushed some service and hospitality workers into neighboring counties or out of the region, Quartz said. The latter is a county-level account, not a measured explanation for Colorado’s activity ranking. Still, it raises a fair question for any appealing health statistic: whose home address places them in the group being counted?
The strongest case for public investment in movement is modest and concrete. Land protection can keep destinations public; paths can connect parts of a city; safer crossings can remove one reason to turn back. The CDC’s inactivity figure tells us Colorado had a comparatively small share of adults reporting no activity outside work in the survey period. It cannot assign credit among routes, income, migration, geography and individual circumstances.
A ranking can prompt a better local question than “How do I become like Colorado?” Try this one instead: if someone wants to move in a way they enjoy, what stands between their front door and a place to do it?
More Like This

How Sports Actually Bring People Together
Sports are celebrated as a universal unifier—but how does that actually work, and when does it fall short? We map the real science and the real limits.

How Streaming Platforms Use Psychology to Hold Your Attention
Streaming platforms are built on behavioral science. Here's what media psychology actually says about autoplay, thumbnails, and what prolonged watching does to your body.