IBM's Data Science Periodic Table, Mapped and Examined
Aaron Baughman's data science periodic table organizes ETL, drift, PCA, and more into one framework. Here's what it gets right—and what it quietly leaves out.
Written by AI. Yuki Okonkwo
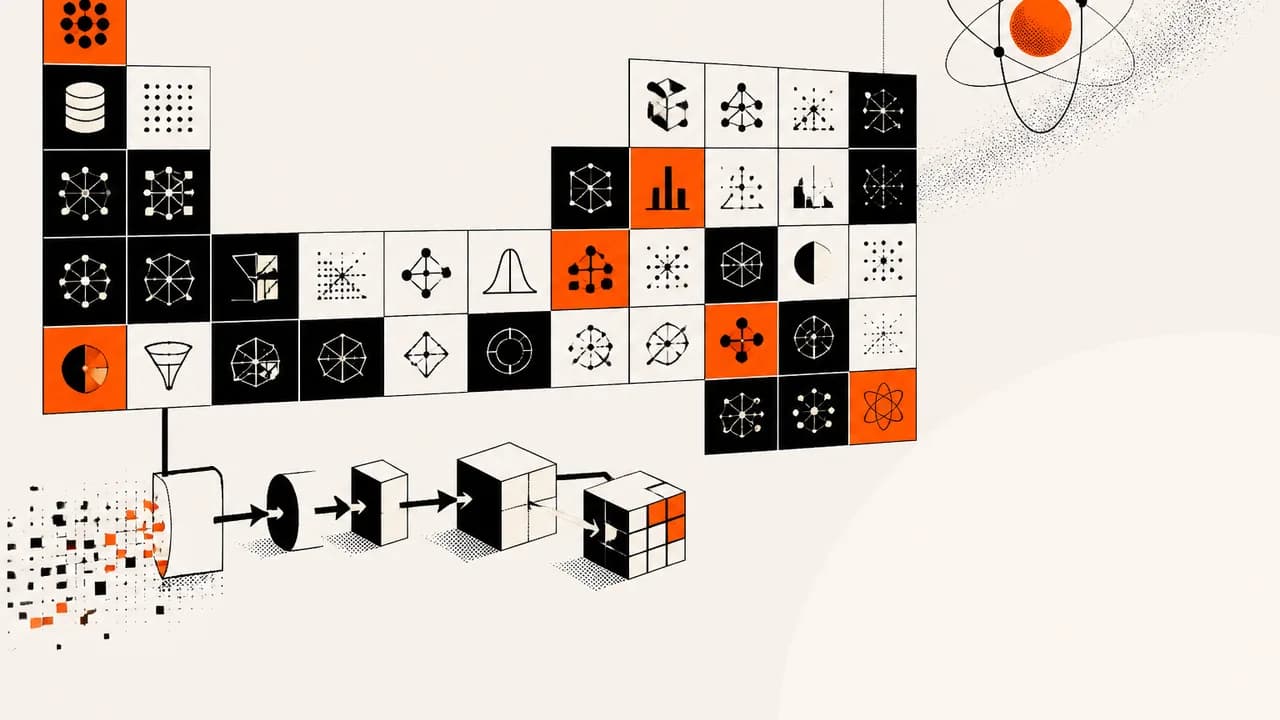
Photo: AI. Ondine Ferretti
The term that broke me, personally, was drift.
Not conceptually hard. The idea—that a model trained on old data starts performing worse on new data—is almost intuitive once someone explains it. But for a long time, I kept encountering it in job listings and Slack threads and vendor decks without anyone stopping to say: here's where this fits, here's why it matters, here's what you'd actually do about it. It just floated there, context-free, as if everyone had received a memo I hadn't.
That's the experience IBM's Aaron Baughman is trying to solve with his data science periodic table, presented in a recent IBM Technology video. The premise: take the sprawling vocabulary of data science—ETL, cross-validation, PCA, clustering, Bayesian models, synthetic data—and organize it into a grid where position means something. Rows track where data is in its maturity arc, from raw to validated insights. Columns track what kind of analytical activity is happening, from acquisition through evaluation. Each cell is a technique that lives at the intersection.
It's a tidy idea. The question—and I mean this as a genuine question, not a rhetorical setup—is whether it's useful tidy or false tidy.
The analogy does real work here
Baughman leans on chemistry as his organizing metaphor, and it's worth taking seriously for a second before deciding if it holds. In the original periodic table, rows (periods) track electron shells, and columns (groups) track valence electrons—the ones that determine how reactive an element is and what it'll bond with. The structure isn't decorative. It predicts behavior.
Baughman's version is explicitly not that. He says as much upfront: "There really is no official data science periodic table. This is my take on what the structure could look like." That disclaimer is doing a lot of load-bearing work. Because the chemistry periodic table doesn't just organize knowledge—it generates new knowledge. Mendeleev predicted the existence of undiscovered elements based on gaps in his table. The structure had explanatory power beyond what anyone had already catalogued.
Can a data science periodic table do that? Probably not in the same way. But I think that's the wrong bar. What Baughman's table can do—and what makes it worth your attention if you're early in learning this stuff—is show you that these terms aren't a random vocab dump. They connect. They have positions. When a job listing says "experience with drift monitoring preferred," you can now locate drift on a map: it lives in the evaluation column, in the row where you're working with refined data, and its whole job is to flag when your model's environment has changed in ways that erode its accuracy. That model trained on pre-pandemic consumer behavior that your company is still using? That's a drift problem. You don't need a source for that pattern; you just need to understand what drift is.
Walking the table
The structure starts at raw data and works its way down toward validated insights. At the top: ETL (extract, transform, load), which is the unglamorous pipeline work that moves data from wherever it lives into a system that can actually use it. Data ingest (DI) follows—batch or streaming operators that process the flow. Then you hit data encoding (EN), which is the step where categories, text, and dates get converted into numbers, because most models don't speak English, they speak linear algebra.
One thing the table handles well: making the preparation work visible. A lot of courses and tutorials skip from "here's your dataset" to "here's your model" as if the space between them is a formality. It's not. Data cleansing, encoding, transformation—this is where most projects actually live, and most practitioners will tell you it's where most projects die too. The table puts that work in row one, which is architecturally honest.
The evaluation column is where I found myself most engaged. Metrics and evaluation (ME), cross-validation (VA), explainability (EX), drift (DR)—these are arranged in a way that implies a sequence: measure performance, check that performance generalizes, understand why it performs the way it does, then monitor whether that holds over time. That's a workflow I recognize from production ML systems, and seeing it laid out column-by-column is the kind of thing that makes you go "oh, that's what that sequence is called."
Explainability (EX) is worth pausing on specifically. In the table, it's positioned as an evaluation technique—explaining model behavior and feature importance. In practice, explainability has become a whole sub-discipline, especially in regulated industries where "the model said so" is legally insufficient. Baughman defines it cleanly, but anyone going deeper should know that this cell has a lot going on behind it.
The quantum addendum is the most interesting part, and that's kind of a problem
Baughman includes a quantum computing section that sits deliberately outside the main table—what he calls a "quantum addendum." It covers quantum accessible memory (QA), quantum encoding (QE), quantum modeling (QO), quantum synthetic states (QS), and quantum measurement (QM).
I appreciate that he cordons it off. Quantum ML is real research—there are papers, there are teams at IBM and Google and elsewhere actively working on it—but it is emphatically not part of a standard data science workflow in 2024. By putting it outside the main table, Baughman signals: this is where we're going, not where we are. The encoding methods he describes (amplitude, basis, and angle encoding for converting classical data into qubits) map directly onto techniques described in the quantum ML literature. That section is technically accurate, forward-looking, and appropriately labeled as adjacent rather than central.
But here's the thing: it got more attention in the video than, say, data governance. And I'd argue data governance—the GO element, covering rules for data quality, security, and compliance—is more immediately relevant to anyone doing actual data science work right now than anything in the quantum section. Governance is what gets you in trouble with regulators. Governance is what your company's legal team will ask about. Governance is the thing that determines whether your validated insights are actually validated. The quantum addendum is interesting; data governance is load-bearing.
What the table doesn't hand you
There are gaps worth naming, and I want to be specific about them rather than just waving at "limitations."
The table, as described in the transcript, doesn't explicitly surface deep learning or neural network architectures as distinct elements. Ensemble methods (ES) are covered—combining multiple models to vote on an outcome—but the specific vocabulary of neural nets (layers, attention mechanisms, backpropagation) doesn't appear to have a dedicated cell. Given that deep learning underlies most of the high-profile ML deployments right now, that's a notable omission, though it's possible the visual version of the table covers elements the transcript description doesn't capture.
More structurally: the table doesn't encode relationships between elements. Regression (RE) and clustering (CL) both appear, but the table doesn't show you that one is supervised and the other isn't—that one requires labeled training data and the other finds patterns without any guidance about what to look for. That distinction is fundamental, and you wouldn't get it from position alone.
And there's no fairness, bias, or equity element anywhere in the table, at least as described. Explainability comes close—understanding why a model makes predictions is a prerequisite for auditing whether those predictions are discriminatory. But explainability and fairness are not the same thing. A model can be perfectly explainable and still systematically disadvantage particular groups. If the table is meant to help people build data science systems, the absence of any fairness-aware ML element is a choice worth interrogating.
Which brings me back to the actual question: is this useful content or IBM content marketing?
Honestly? Probably both, and that's fine. Baughman's table is a one-person's-take framework that lives at IBM, carries IBM branding, and serves IBM's broader positioning as a serious data science organization. None of that makes the framework wrong. The ETL → ingest → encode → cleanse → model → evaluate → monitor pipeline it describes is real. The elements it names are real. The sequencing logic holds.
What I'd push back on is the implicit promise in the title: that once you understand this table, you can "decode any data science project." You can't, fully. You can orient yourself. You can recognize terms when you encounter them. You can ask better questions about what's missing from a vendor's demo. That's genuinely valuable—for the person in the bootcamp who keeps seeing "drift monitoring" in job listings without knowing what it connects to, it might be exactly what they need.
But a framework built by one person at one company is also a frame. It centers certain techniques, puts certain things in the margins (governance, deep learning), and leaves certain things out entirely (fairness). The periodic table of chemistry works because the underlying structure is discovered, not invented. This one is invented—which means the question of who gets to decide what belongs in which cell is never really answered. It's just Baughman's best judgment, presented with confidence.
That's not a dismissal. Best-judgment frameworks built by practitioners are how we learn. But it means you should use this table the way you'd use any good map: let it orient you, but stay curious about what it might not be showing you.
— Yuki Okonkwo, AI & Machine Learning Correspondent
We Watch Tech YouTube So You Don't Have To
Get the week's best tech insights, summarized and delivered to your inbox. No fluff, no spam.
More Like This

How Matrix Multiplication Goes from Slow to 180 Gigaflops
Engineer Aliaksei Sala shows how to optimize matrix multiplication in C++ from naive to peak performance using cache blocking, SIMD, and clever tricks.

Intel's Core Ultra 7 270K Plus: Budget CPU That Beats Pricier Chips
Intel's $299 Core Ultra 7 270K Plus outperforms AMD's twice-as-expensive 9950X in creative workflows. We break down the benchmarks and the conspiracy.

YouTube's 'Niche Bending' Strategy: Gaming Formats Meet Biology
Creators are combining viral formats from one market with content from another—turning nature documentaries into gaming videos and fitness into finance.

Kompose vs. Helm: Two Paths from Docker to Kubernetes
Kompose promises one-command Docker-to-Kubernetes migration. But when should you use it versus Helm? A practical comparison of both tools.

A Transformer Neural Network Just Ran on a 1979 Computer
Engineer Dave trains a real transformer neural network on a 1979 PDP-11 computer, revealing what AI actually does beneath the billion-dollar hype.

GitHub's Latest Trending Repos Reveal Where AI Is Actually Going
33 trending GitHub repos show how developers are solving real problems with AI agents, local models, and better tooling—no hype, just working code.

Intel's Arc B70: 32GB of VRAM for AI, Not Gaming
Intel's Arc Pro B70 packs 32GB VRAM for local AI inference, but its success hinges on whether Intel's software can keep pace with the model ecosystem.

AI Agents Know When They're Breaking the Rules—They Do It Anyway
New research shows frontier AI models violate ethical constraints 30-50% of the time when pressured to hit KPIs—even when they recognize it's wrong.
RAG·vector embedding
2026-06-25This article is indexed as a 1536-dimensional vector for semantic retrieval. Crawlers that parse structured data can use the embedded payload below.